
Full Breakdown
India’s Poverty Decline 2011-2023: Gains, Gaps, and the Road Ahead
By Drooid · · How we work
In this breakdown
01
Background & Context
The World Bank’s October 2026 *Poverty and Equity Brief* records a rapid reduction in extreme and lower-middle-income poverty in India from 2011 to 2023, driven by stronger household consumption, expanding employment—especially among women—and broader social transfers such as food subsidies.
02
Key Data & Statistics
- People lifted out of poverty: 496 million moved above the $4.20-a-day threshold.
- Extreme-poverty rate: Fell from 27.1 % (2011) to 2.6 % (2023).
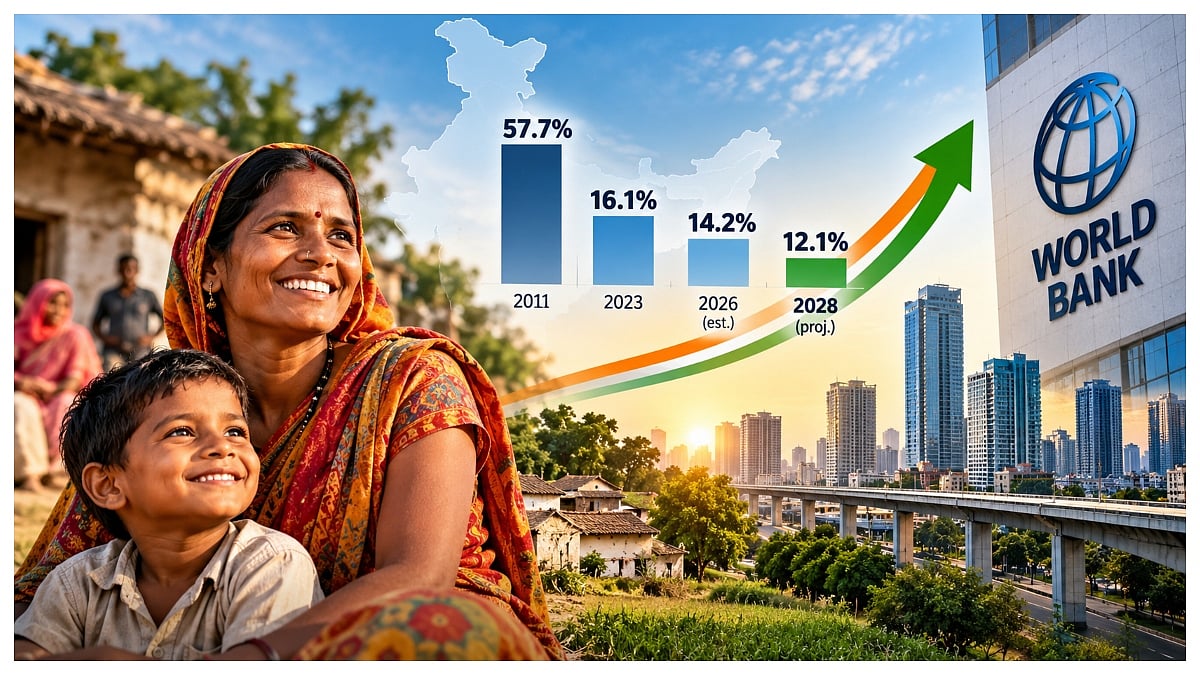
- Lower-middle-income poverty rate: Declined from 57.7 % to 16.1 %.
- Multidimensional poverty: Oxford’s index dropped from 53.8 % (2005-06) to 16.4 % (2019-21); the World Bank’s measure was 15.5 % in 2022-23.
- Income distribution: Gini = 23.0 (2023); median earnings of the top 10 % were about 13 times those of the bottom 10 %.
- Employment growth: 134 million jobs added (2017-2023), nearly twice the working-age population increase, with a substantial share for rural women.
- Youth unemployment: Rose from 14.6 % to 15.9 % between FY 2026 Q1 and FY 2027 Q1, affecting rural young women most.
Visual evidence
Images from the story

03
Regional Disparities and Inequality
Rural poverty stood at 19.3 % in 2023 versus 8.6 % in urban areas. A belt from Uttar Pradesh to West Bengal contains roughly 57 % of India’s poor. Poverty correlates with education: 21.3 % of adults with no schooling were poor, versus 7.4 % with tertiary education. Children aged 0-14 had the highest poverty rate at 21.8 %.
04
Employment Trends and Wage Stagnation
Job growth occurred mainly in low-productivity activities, limiting real earnings. The wage gap persisted, reflected in the 13-fold median earnings differential between the top and bottom deciles.
05
Official Statements & Responses
The World Bank stresses that further reductions will depend on more productive employment in the Uttar Pradesh-West Bengal belt and notes its projections—14.2 % poverty at $4.20-a-day in 2026 falling to 12.1 % by 2028—are model-based and could shift with new data.
06
Conflicting Reports & Gaps
*Financial Express* and *Free Press Journal* point to methodological limits in household consumption surveys, suggesting measurement changes may partly explain the gains and that wealthier households could be under-counted, understating inequality. Rural-urban population estimates rely on the 2011 Census, potentially skewing poverty rates.
07
Projected Outlook
Scenario modeling indicates a moderating pace of decline, with the $4.20-a-day poverty rate projected at 12.1 % by 2028. Meeting this target will require policies that address regional concentration, improve job quality, and raise real wages for rural youth and women.